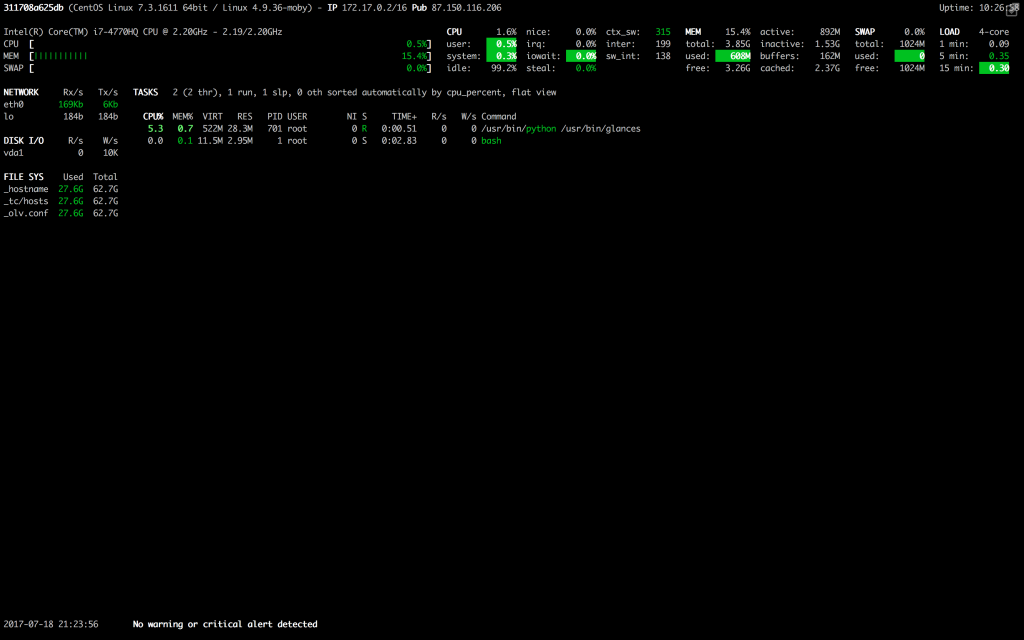
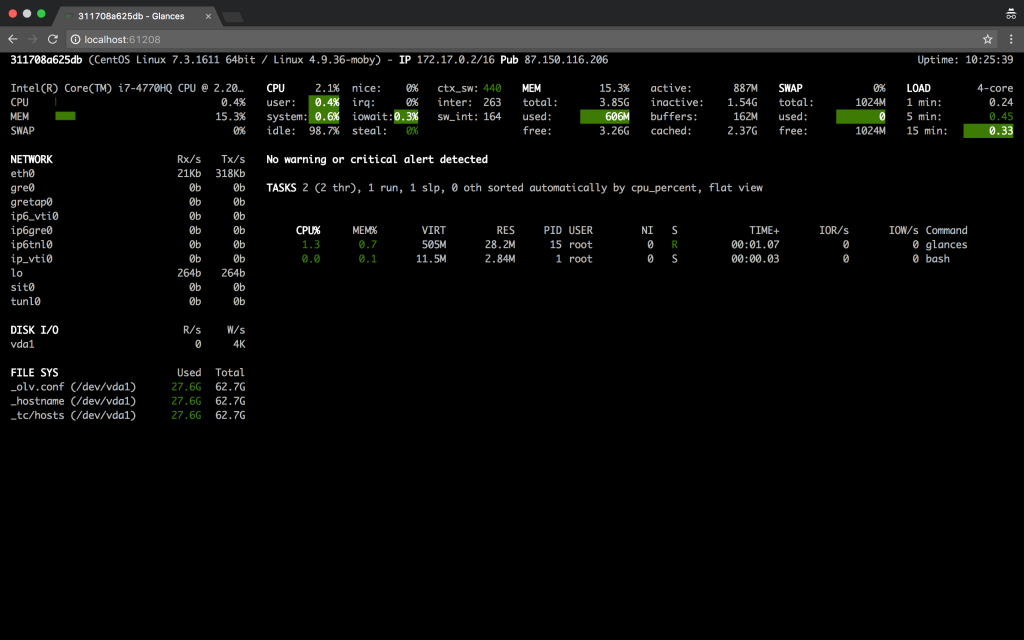
Glances is a cross-platform monitoring tool which aims to present a maximum of information in a minimum of space through a curses or Web based interface. It can adapt dynamically the displayed information depending on the user interface size.
It can also work in client/server mode. Remote monitoring could be done via terminal, Web interface or API (XML-RPC and RESTful). Stats can also be exported to files or external time/value databases.
Requirements
python 2.7,>=3.3psutil>=2.0.0(better with latest version)
Features of Glances
- CPU
- Memory
- Load
- Process list
- Network interface
- Disk I/O
- IRQ / Raid
- Sensors
- Filesystem (and folders)
- Docker
- Monitor
- Alert
- System info
- Uptime
- Quicklook (CPU, MEM, LOAD)
References: https://github.com/nicolargo/glances
Install glances on centos 7
Method 1 – Glances Auto Install Script
There are several methods of installing glances and that depends upon which distribution you are installing upon. Here I am installing it on Centos 7.3.
To install both dependencies and latest Glances production ready version (aka master branch), just enter the following command line:
curl -L https://bit.ly/glances | /bin/bashor
wget -O- https://bit.ly/glances | /bin/bash
Note: The above method is only supported by some Linux distributions.
You may also like: How to install glances system monitoring tool
Method 2 – PyPI
To install glances using PyPI method simply execute following command:
pip install glances
If you want to use the other optional features of glance you need to install the following packages.
pip install glances[action,browser,cloud,cpuinfo,chart,docker,export,folders,gpu,ip,raid,snmp,web,wifi]
Glances Commands
Execute the following command to see the example of usage of glances. We will run glances in different modes.
glances -h
Examples of use:
Monitor local machine (standalone mode):
$ glances

Monitor local machine with the Web interface (Web UI):
$ glances -w
Glances web server started on http://0.0.0.0:61208/

Monitor local machine and export stats to a CSV file (standalone mode):
$ glances --export-csv /tmp/glances.csv

Monitor local machine and export stats to a InfluxDB server with 5s refresh
time (standalone mode):
$ glances -t 5 --export-influxdb

Start a Glances server (server mode):
$ glances -s

Connect Glances to a Glances server (client mode):
$ glances -c <ip_server>

Connect Glances to a Glances server and export stats to a StatsD server (client mode):
$ glances -c <ip_server> --export-statsd

Start the client browser (browser mode):
$ glances --browser
Run Glances
Now there are different ways to run the glances i.e
- Standalone mode
- Web Server mode
- Client Server mode
Standalone mode
Just execute the following command to start glances in standalone mode
glances
Web Server Mode
If you want to start glances in web server mode just execute following command. Glances will run on port 61208
glances -w
After executing this command go to browser and go to following address to see glances
https://ip-address:61208
In my case its localhost:61208
You may also like: How to install bucardo for postgres replication
Client Server Mode
You can run glances in Client/Server mode also. You need to run the glances on remote linux server in order to access the data from the server. You can access data as client. Let’s see how we can do this.
Execute this command on remote server
glances -s
Now execute following command on local machine to access the data of remote machine
glances -c ip-address-of-remote-machine
Exporting the stats to csv file
Glances also provide ability to export the stats into csv file. Let’s exports the stats into csv file.
glances --export-csv/tmp/glances.csv
The above command will save the stats into /tmp/glances.csv.


Leave a Reply