In this article, I will show you how you can create a grafana dashboard for Kubernetes Deployment. I am using Prometheus-operator and it is really good if you want to monitor your Kubernetes cluster. So, let’s get started.
I have installed Prometheus-operator using helm with the official helm chart.
https://github.com/helm/charts/tree/master/stable/prometheus-operator
Grafana Dashboard for Kubernetes Deployment
There are 2 metrics that you can use to monitor the pods deployments on Kubernetes using Prometheus.
| kube_deployment_spec_replicas | The number of desired pods for a deployment. | kube-state-metrics |
| kube_deployment_status_replicas | The number of replicas per deployment. | kube-state-metrics |
So let’s create this graph in Grafana.
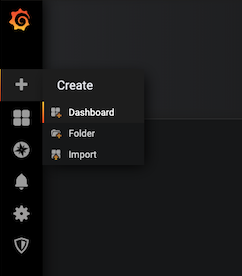
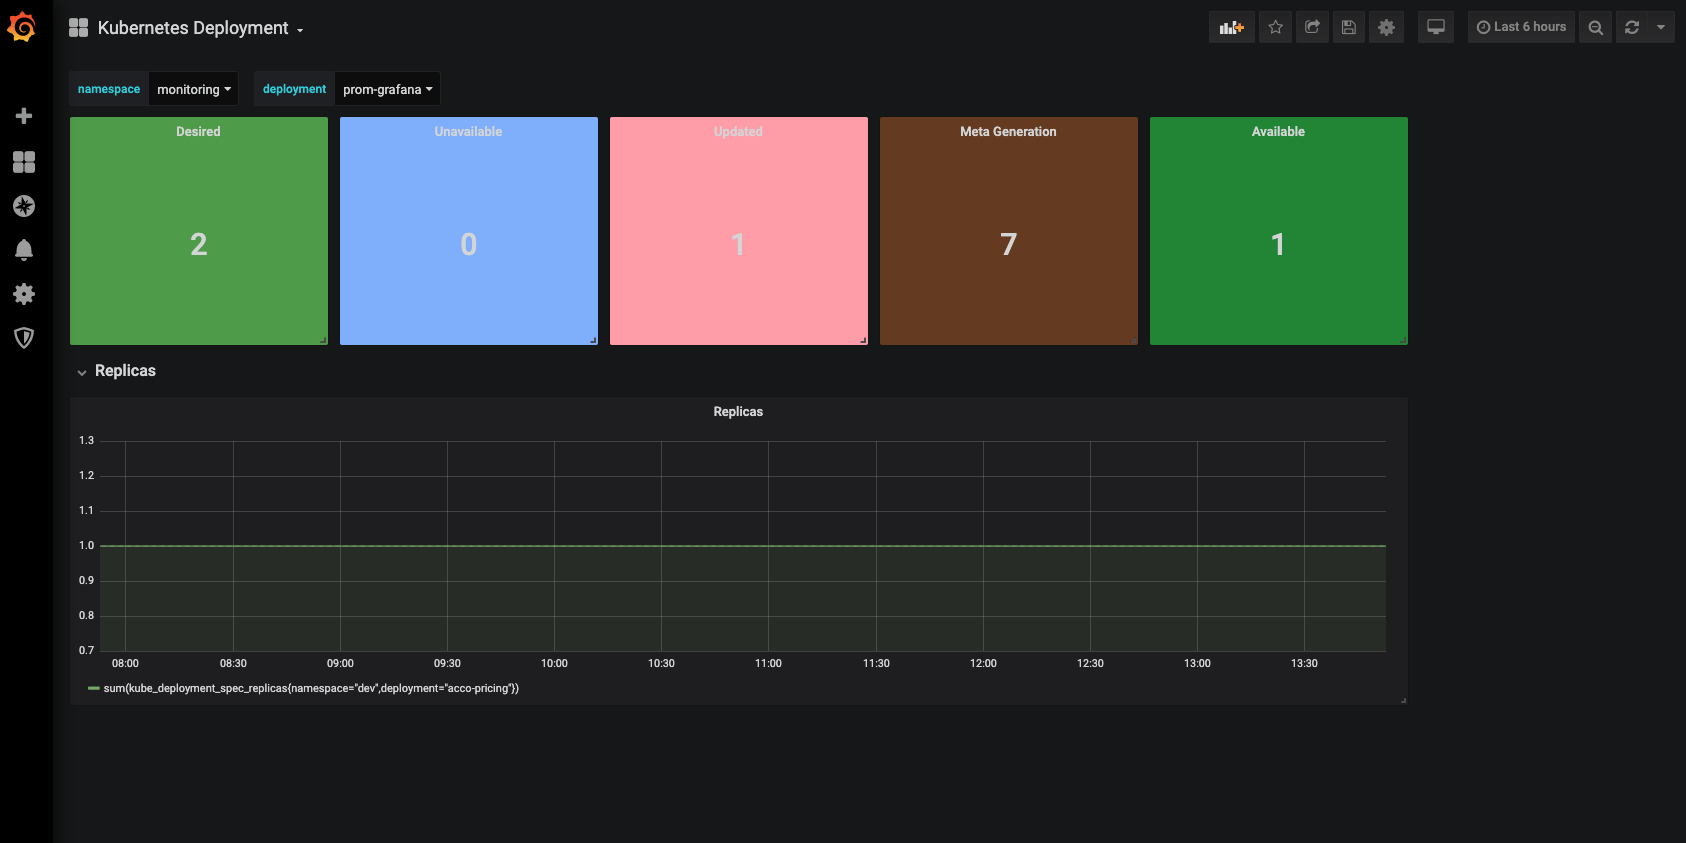
Create a new Dashboard and create 2 variable namespace and deployment. We are creating this variable so we can filter the pods easily.
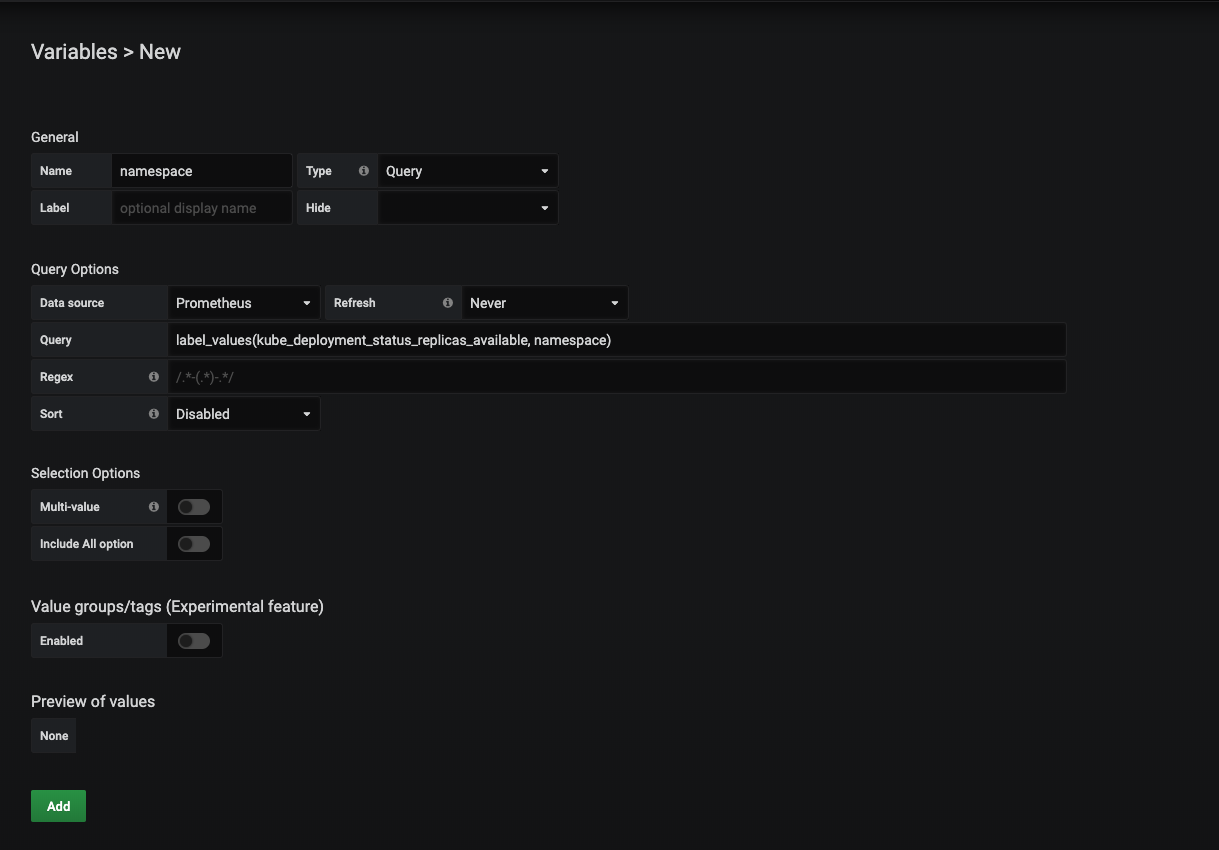
- Create a variable called namespace and add the following query.
label_values(kube_deployment_status_replicas_available, namespace)
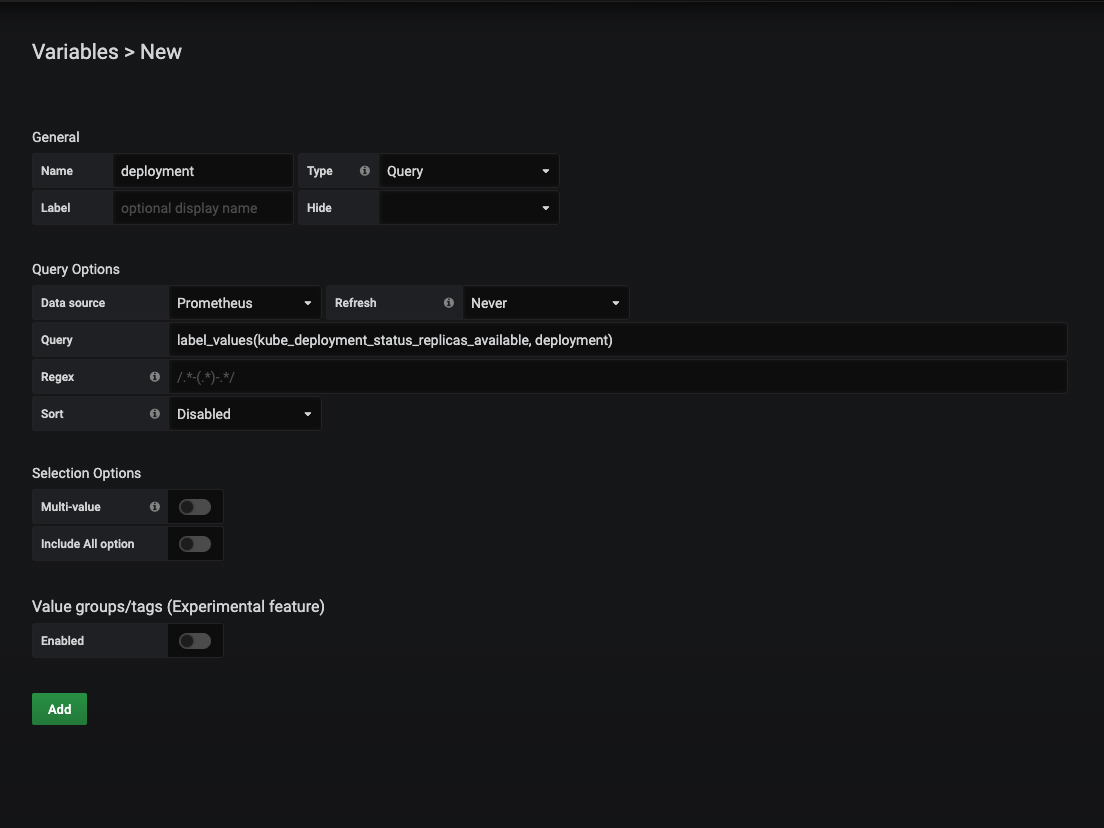
2. Create another variable called deployment.
label_values(kube_deployment_status_replicas_available, deployment)
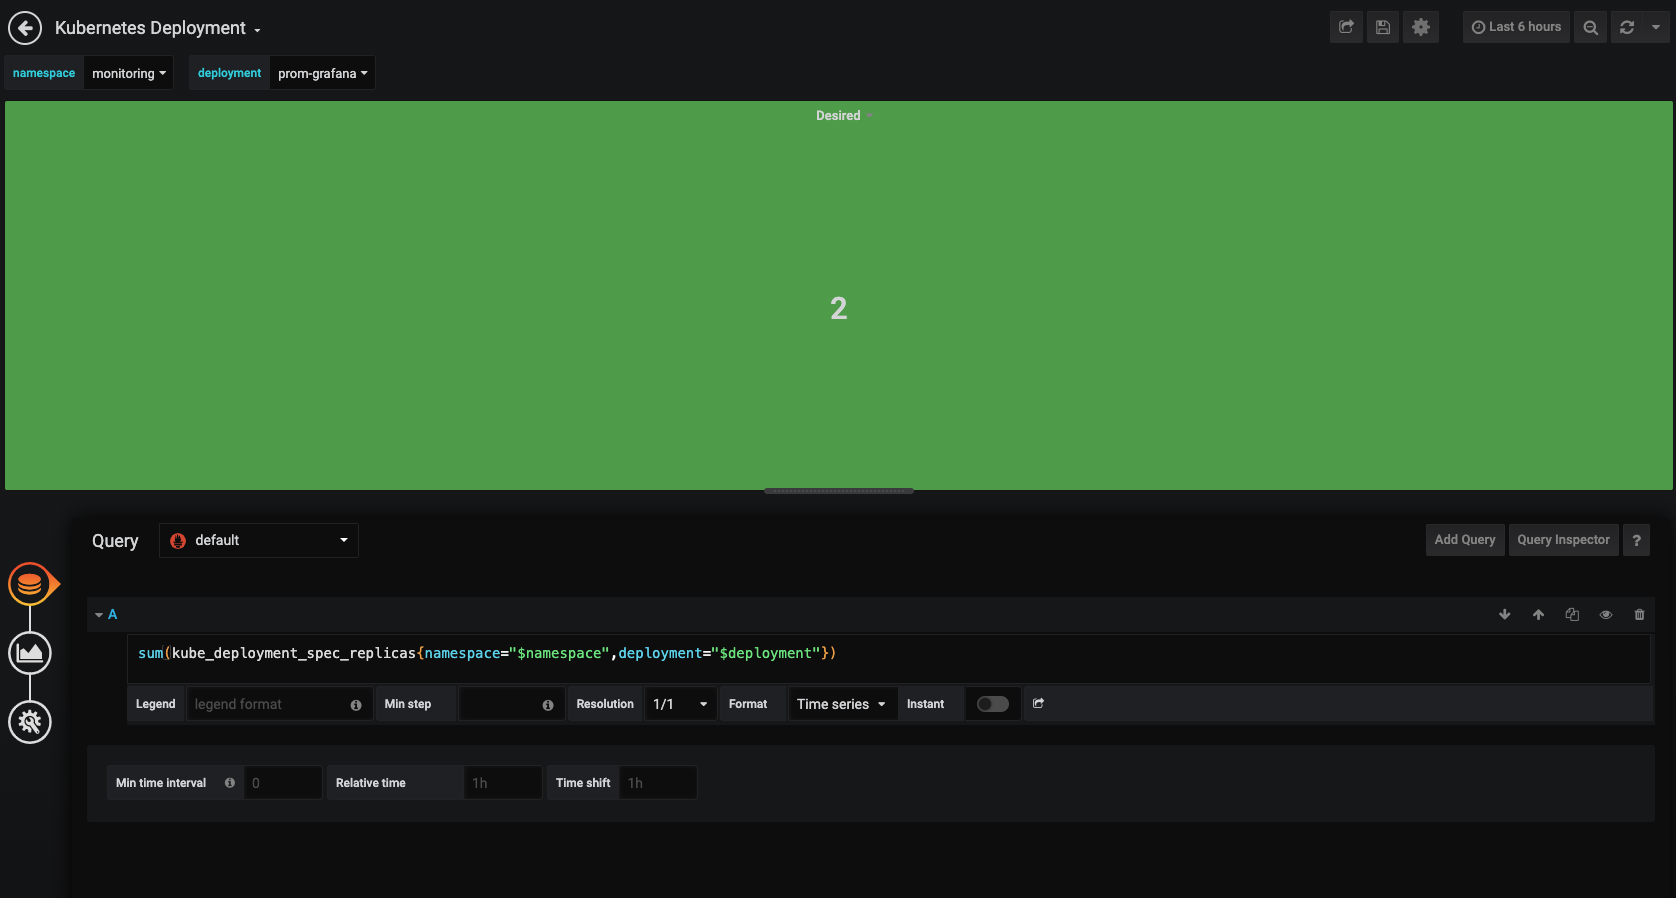
Select visualization as Single stat.
After selecting the Visualization and add the following query and name it as Desired.
sum(kube_deployment_spec_replicas{namespace="$namespace",deployment="$deployment"})
Similarly, create another graph with the following queries.
Unavailable
sum(kube_deployment_status_replicas_unavailable{namespace="$namespace",deployment="$deployment"})
Updated
sum(kube_deployment_status_replicas_updated{namespace="$namespace",deployment="$deployment"})>/code>
Metadata Generation
sum(kube_deployment_metadata_generation{namespace="$namespace",deployment="$deployment"})


Leave a Reply